


 16 / 102

CARDIOVASCULAR JOURNAL OF AFRICA • Volume 27, No 3, May/June 2016
138
AFRICA
weeks post AAC, IVSd and LVPWd were decreased to 177%
and 141% of the sham values, respectively. IVSs remained at the
same level at four and six weeks post AAC, which was 137% of
the control values. In the AAC rats, LVPWs were significantly
increased (112–129% of the sham values) four weeks post
surgery, a trend that continued to six weeks. Subsequently, the
AAC rats had no marked chamber dilatation; however, some
time points showed statistically significant yet marginal increases
in ESV and IVIDs (at four weeks), and EDV and LVIDd were
decreased significantly at three weeks post AAC.
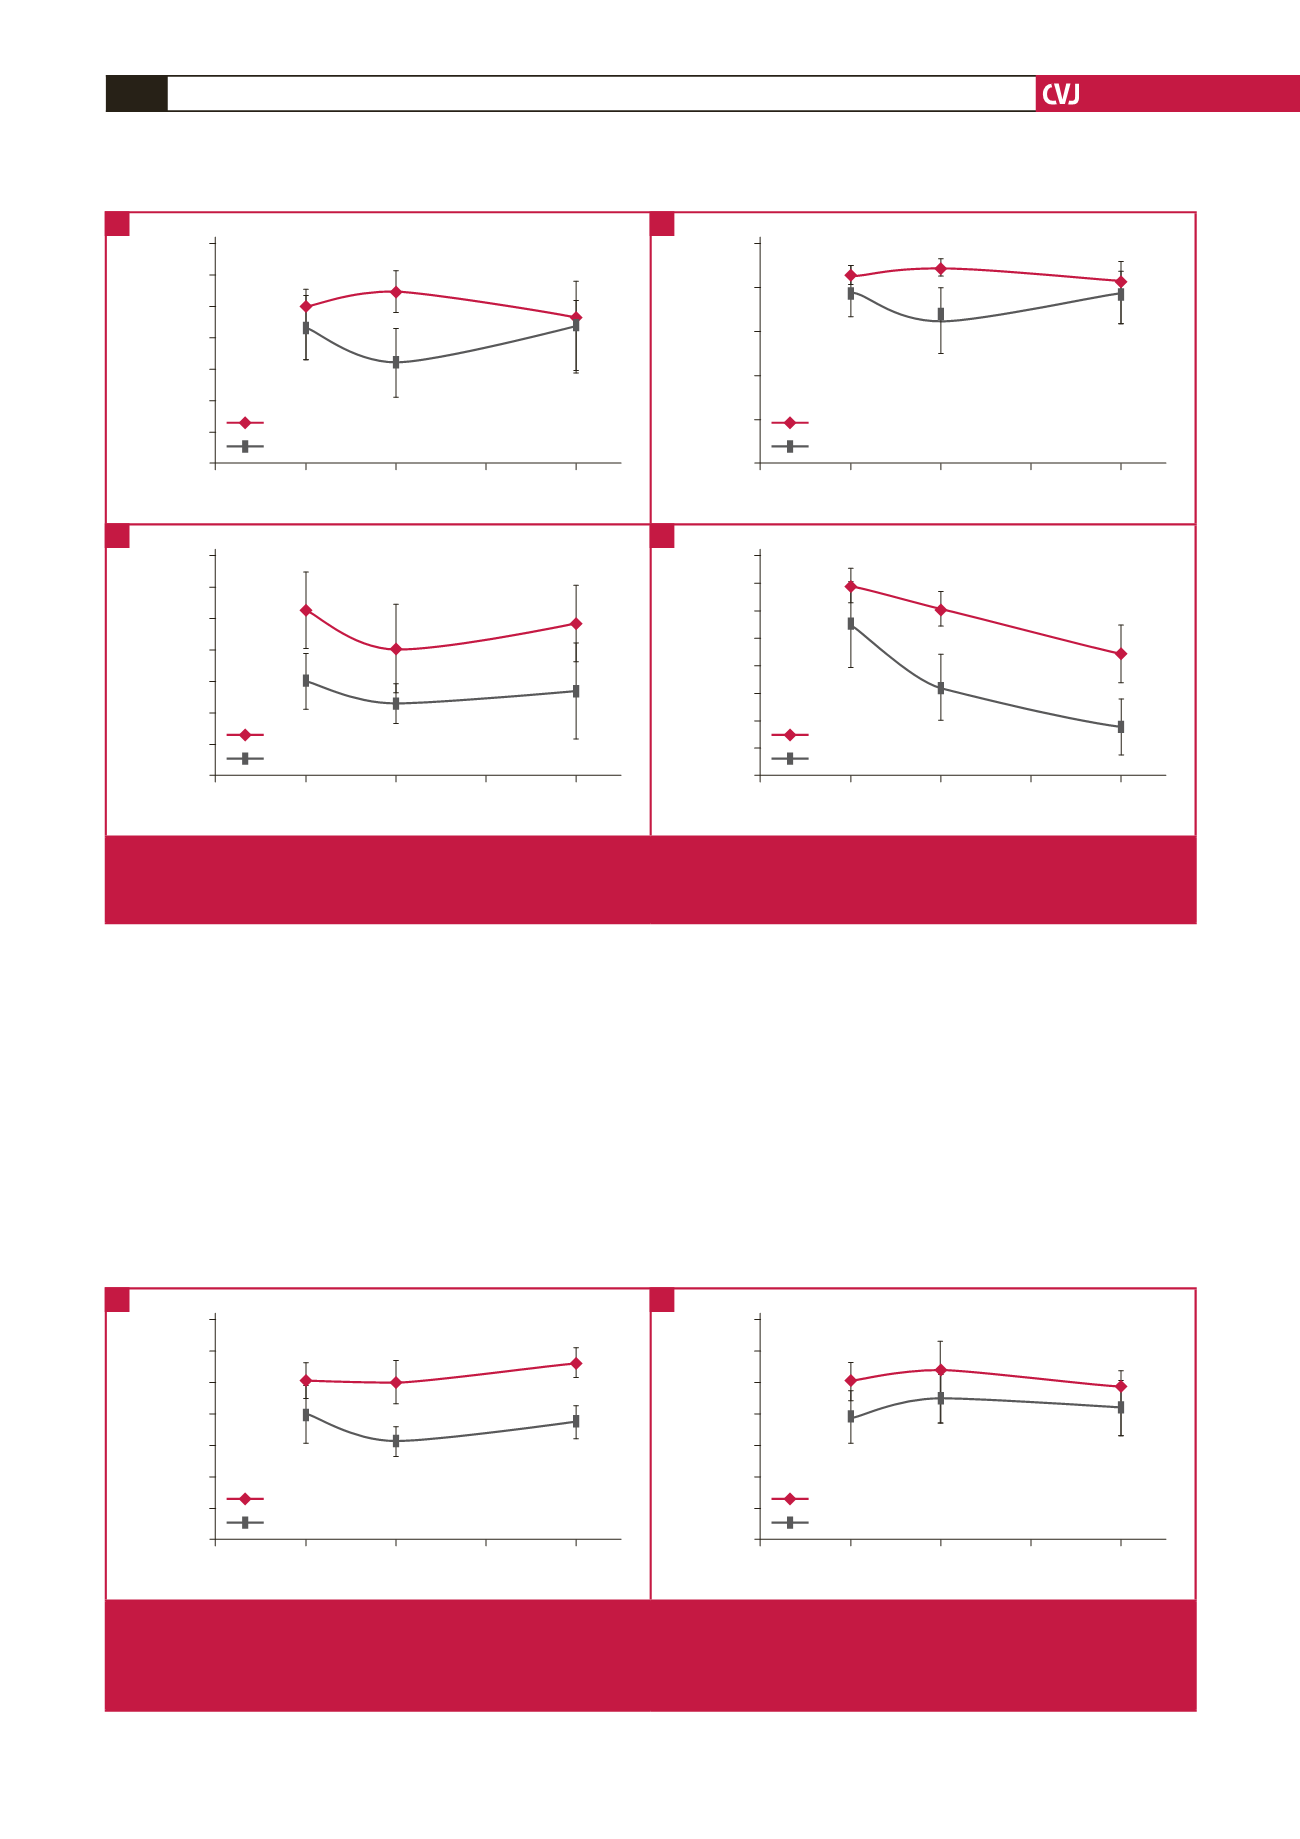
Fig. 4 shows the changes in FS, EF, CO and HR that occurred
over the six-week time course in both sham and AAC rats. In
the AAC rats, reduced systolic function was first noted at three
weeks post surgery, with significant reductions in FS and EF
(Fig. 4A, B). Both of these trends continued to four weeks, where
these parameters in the AAC group were markedly decreased
(FS: 54.9
±
6.5% for sham vs 32.3
±
10.9% for AAC; EF: 89.4
±
4.0% for sham vs 65.3
±
15.2% for AAC). FS and EF had slightly
recovered at six weeks, but were still decreased compared with
the sham values (FS: 46.6
±
5.0% for sham vs 43.7
±
14.5% for
AAC; EF: 83.0
±
4.8% for sham vs 77.9
±
14.2% for AAC). These
differences did not reach statistical significance.
2
3
4
5
6
Weeks
FS (%)
70
60
50
40
30
20
10
0
Sham
AAC
**
*
2
3
4
5
6
Weeks
EF (%)
100
80
60
40
20
0
Sham
AAC
**
*
2
3
4
5
6
Weeks
CO (l/min)
0.14
0.12
0.10
0.08
0.06
0.04
0.02
0.00
Sham
AAC
**
**
**
2
3
4
5
6
Weeks
HR (bpm)
450
440
430
420
410
400
390
380
370
Sham
AAC
Fig. 4.
FS (A), EF (B), CO (C) and HR (D) of AAC models. *
p
<
0.05 vs sham control, **
p
<
0.01 vs sham control. The
n
values are
given for each group at three, four and six weeks in sequential order. ANOVA was performed to compare the AAC and sham
groups when the probability value was statistically significant. An LSD
t
-test was applied for multiple comparisons.
A
C
B
D
2
3
4
5
6
Weeks
PFVA (cm/s)
140
120
100
80
60
40
20
0
Sham
AAC
**
**
2
3
4
5
6
Weeks
E wave (cm/s)
140
120
100
80
60
40
20
0
Sham
AAC
**
**
**
Fig. 5.
Time course of velocity parameters obtained using Doppler echocardiography in both sham and AAC rats. PFVA, peak flow
velocity of aorta; E wave, peak early diastolic filling velocity. *
p
<
0.05 vs sham control, **
p
<
0.01 vs sham control. The
n
values are given for each group at three, four and six weeks in sequential order. ANOVA was performed to compare the AAC
and sham groups, when the probability value was statistically significant. An LSD
t
-test was applied for multiple comparisons.
A
B