


 17 / 102

CARDIOVASCULAR JOURNAL OF AFRICA • Volume 27, No 3, May/June 2016
AFRICA
139
CO was measured in order to differentiate between high-
and low-output failure (Fig. 4C). In the AAC rats, CO was
significantly decreased at the three-week time point, and was
less than half (55% of sham values) by six weeks. HR was not
significantly different between the two groups (Fig. 4D).
Using Doppler echocardiography, as shown in Fig. 5, peak
flow velocity of the aorta (PFVA) was significantly decreased
compared to the sham group from four to six weeks in the AAC
rats. Additionally, the E wave was significantly decreased in the
AAC rats at all time points, beginning as early as three weeks
post surgery (Fig. 5B).
As shown in Table 1, LVMI in the AAC animals was
significantly increased as early as three weeks post surgery, and
remained elevated compared to the sham controls. The same
trend was observed in HMI (
p
<
0.01). By four weeks post AAC,
the ratio of LVMI and HMI were markedly increased, reaching
201 and 191% of the sham values, respectively. At all time points,
the AAC model caused no significant difference in body weight
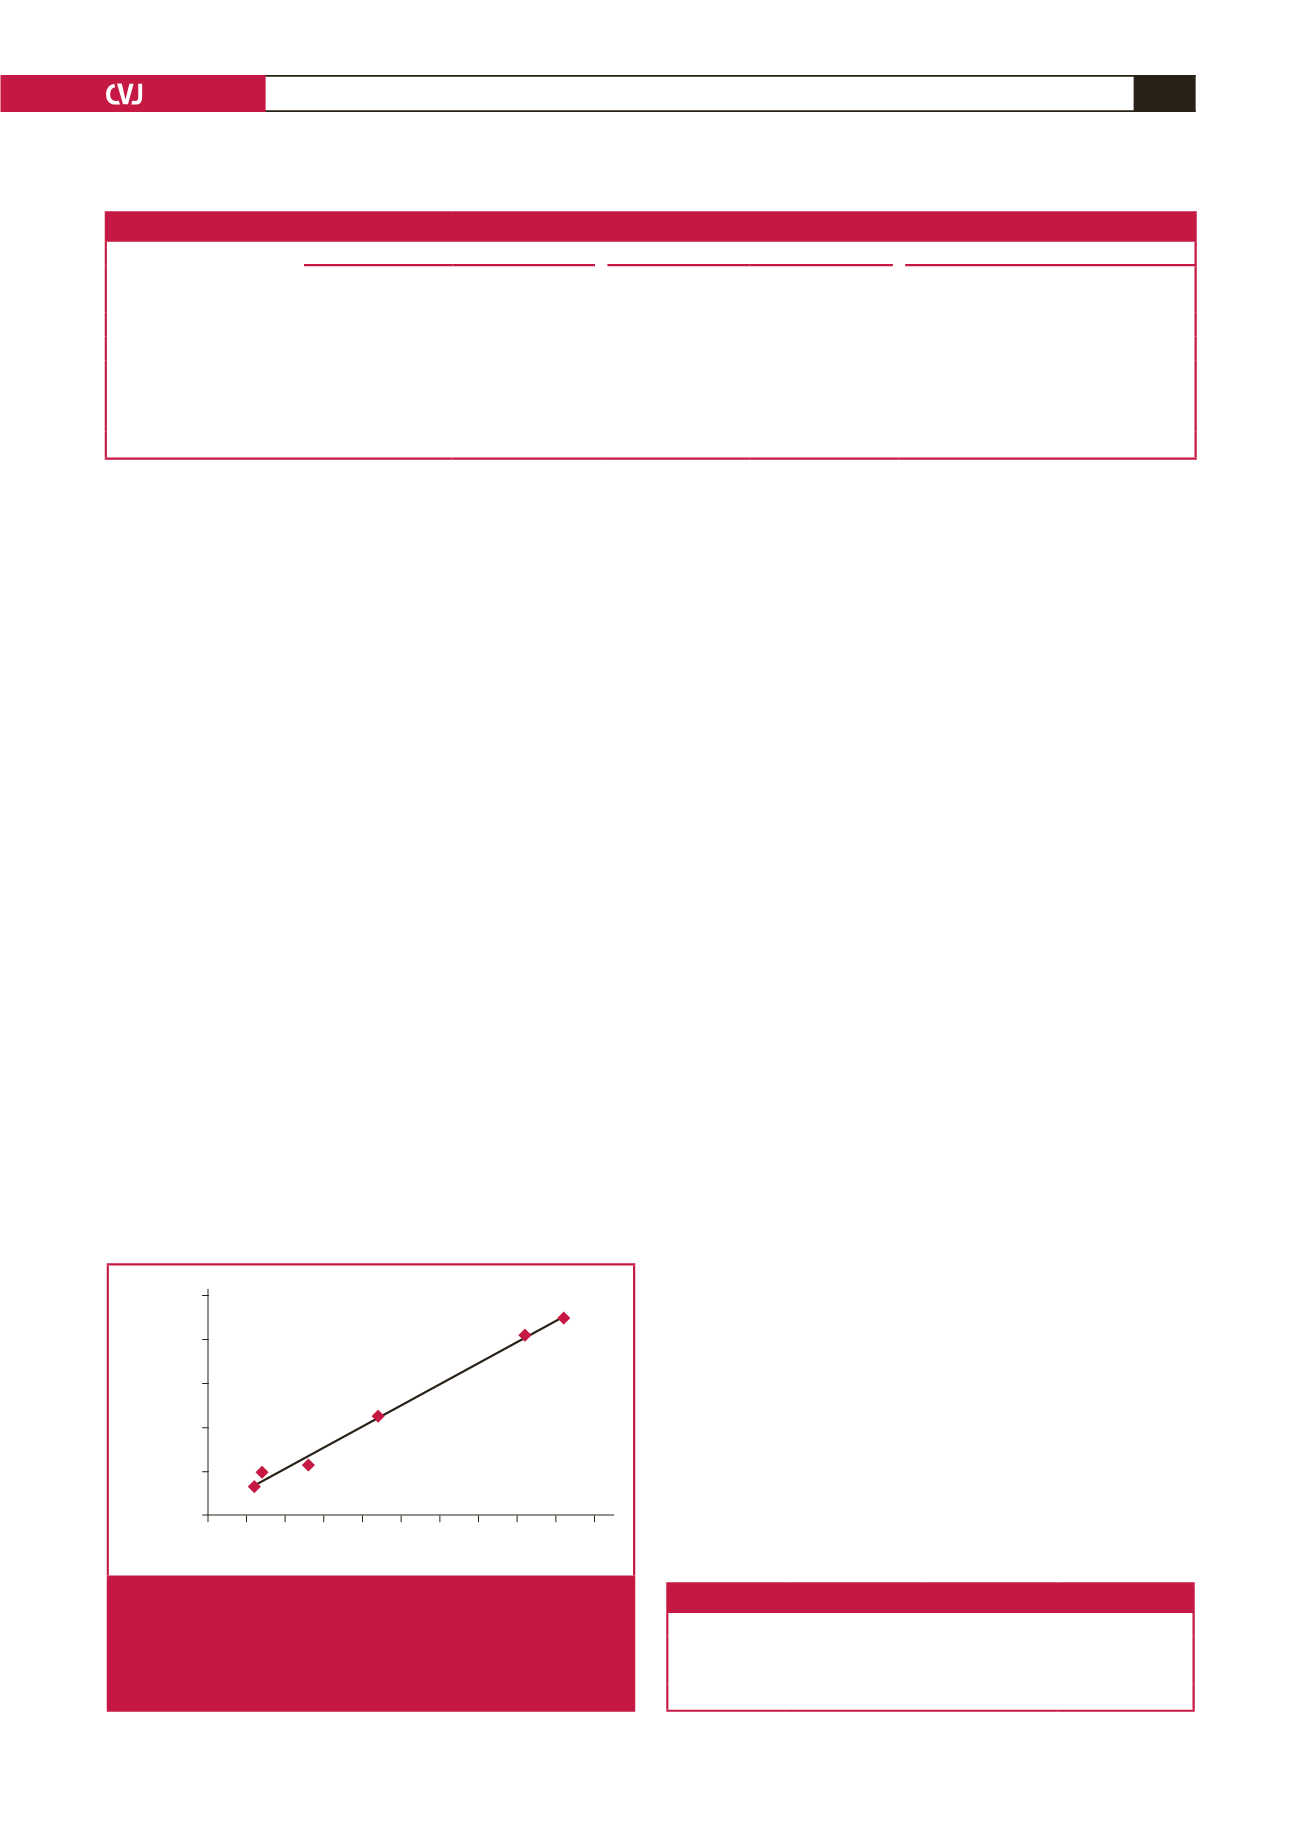
compared to their respective sham controls. In this pressure
overload model, LVm values obtained using echocardiography
were consistent with the actual tissue weights, with a correlation
coefficient of 0.997 (Table 1, Fig. 6).
Fig. 7 shows morphometric images and data from three,
four and six weeks post surgery, comparing myocyte cross-
sectional area (CSA) between the sham and AAC animals with
H&E-stained sections. Pressure overload induced a profound
cardiomyocyte hypertrophy in the ACC rats compared with the
shams, with a 376% increase in CSA at three weeks, 515% at four
weeks, and 294% at six weeks.
Interstitial and perivascular fibrosis measurements are
presented in Figs 8 and 9. The degree of interstitial fibrosis was
elevated in the AAC group compared to the control group at all
time points, but did not reach statistical significance (Fig. 8). In
the AAC group, perivascular fibrosis was significantly increased
at all time points, especially at four weeks (269% of sham values)
(Fig. 9).
Plasma BNP levels were significantly increased in a time-
dependent manner in the AAC group compared to the sham
group (
p
<
0.01, Table 2). BNP plasma concentrations in the
AAC group at six weeks post AAC surgery were 1.37-fold the
level observed at four weeks. However, there were no significant
differences in the sham groups between BNP concentrations at
four and six weeks post surgery.
Discussion
LV pressure overload can be induced by constricting the
ascending aorta, aortic arch or the abdominal aorta in rats, mice
or dogs.
13
AAC is a model of chronic pressure overload that
promotes LVH. In previous studies, adult rats weighing 200–300
g
3,4,14
were typically used to create the AAC model; however,
younger rats weighing 80–100 g were used in our study. The
main advantage of using young animals is to produce overload
pressure gradually via aortic constriction as the animals age,
which is similar to the chronic process of cardiac hypertrophy
caused by hypertension.
2
Our preliminary study confirmed that constricting the
abdominal aorta between the branches of the coeliac and
anterior mesenteric arteries was more effective than constricting
the aorta above the coeliac artery, and was associated with lower
mortality rates and no difference in the timing and progression
to myocardial hypertrophy. Both methods are better than
constricting the abdominal aorta above the left renal artery
for the development of myocardial hypertrophy. In the present
study, we constricted the abdominal aorta between the branches
of the coeliac and anterior mesenteric arteries to a diameter of
0.55 mm, rather than constriction above the left renal artery to a
diameter of 0.80 mm, as in most previous studies.
3-6
Pressure-overload LVH has previously been induced using
AAC for six weeks.
15
However, in our experiment, after three
weeks, the rats developed significant cardiac hypertrophy with
Table 2. BNP plasma concentration in sham and AAC rats
Groups
Three weeks
Four weeks
Six weeks
Sham (pg/ml)
117.23
±
10.49
116.34
±
8.03
113.72
±
10.71
AAC (pg/ml)
477.69
±
22.76** 577.22
±
24.31** 653.29
±
25.99**
**
p
<
0.01 vs sham control
Table 1. General characteristics of the sham and AAC rats
Paramet
er
Three weeks
Four weeks
Six weeks
Sham (
n
=
7)
AAC (
n
=
6)
Sham (
n
=
8)
AAC (
n
=
6)
Sham (
n
=
7)
AAC (
n
=
7)
LV weight (g)
0.47
±
0.04
0.62
±
0.08**
0.46
±
0.04
0.86
±
0.04**
0.53
±
0.03
0.81
±
0.17**
Heart weight (g)
0.58
±
0.04
0.71
±
0.09**
0.57
±
0.05
1.02
±
0.07**
0.65
±
0.03
0.95
±
0.19**
Body weight (g)
189
±
17
173
±
13
216
±
17
201
±
5
246
±
17
217
±
30
LVMI (mg/g)
2.46
±
0.16
3.55
±
0.23**
2.13
±
0.06
4.28
±
0.13**
2.15
±
0.10
3.72
±
0.65**
HMI (mg/g)
3.07
±
0.16
4.11
±
0.22**
2.65
±
0.07
5.07
±
0.26**
2.65
±
0.13
4.40
±
0.71**
LV weight (g)
a
0.496
±
0.099
0.625
±
0.160*
0.464
±
0.085
0.849
±
0.081**
0.513
±
0.100
0.810
±
0.359**
a
LV mass was calculated
in vivo
using echocardiography. *
p
<
0.05 vs sham control, **
p
<
0.01 vs sham control.
0.4 0.5 0.5 0.6 0.6 0.7 0.7 0.8 0.8 0.9 0.9
Actual LVm (g)
Calculated LVm (g)
0.9
0.8
0.7
0.6
0.5
0.4
Fig. 6.
Linear regression analyses of actual heart weights
versus LVm values calculated
in vivo
using echocardi-
ography at all points. Data at each point are the aver-
age weights of AAC and sham groups at three, four
and six weeks, respectively.