
CARDIOVASCULAR JOURNAL OF AFRICA • Volume 27, No 3, May/June 2016
140
AFRICA
a lower acute (24-hour) mortality rate (8% compared with 15%)
than in previous reports.
3,5
Furthermore, the length of the abdominal aorta between
the branches of the coeliac and anterior mesenteric arteries
is short, therefore the constriction site is circumscribed. Our
approach was favourable compared with the traditional method,
which defined the constriction site above the left renal artery
branch of the abdominal aorta, because there are two major
branches here (coeliac and anterior mesenteric arteries), and
the constriction site relative to these branches could impact on
the progression to myocardial hypertrophy, as describe above.
Therefore, development of myocardial hypertrophy in our study
was more stable than in traditional methods.
For monitoring changes in hearts subjected to dynamic
pressure overload, we used echocardiographic measurements.
Echocardiography is a non-invasive method routinely used to
investigate changes in cardiac structure and function in various
disease states. Echocardiography allows repetitive, non-invasive
evaluation in a single live animal, as well as serial determination
of cardiac structure and function to follow disease progression
and response to therapeutic interventions. This method is
far superior and more physiologically relevant than invasive
3
4
6
Weeks
Cell CSA (mm
2
)
1000
800
600
400
200
0
**
**
**
Sham AAC
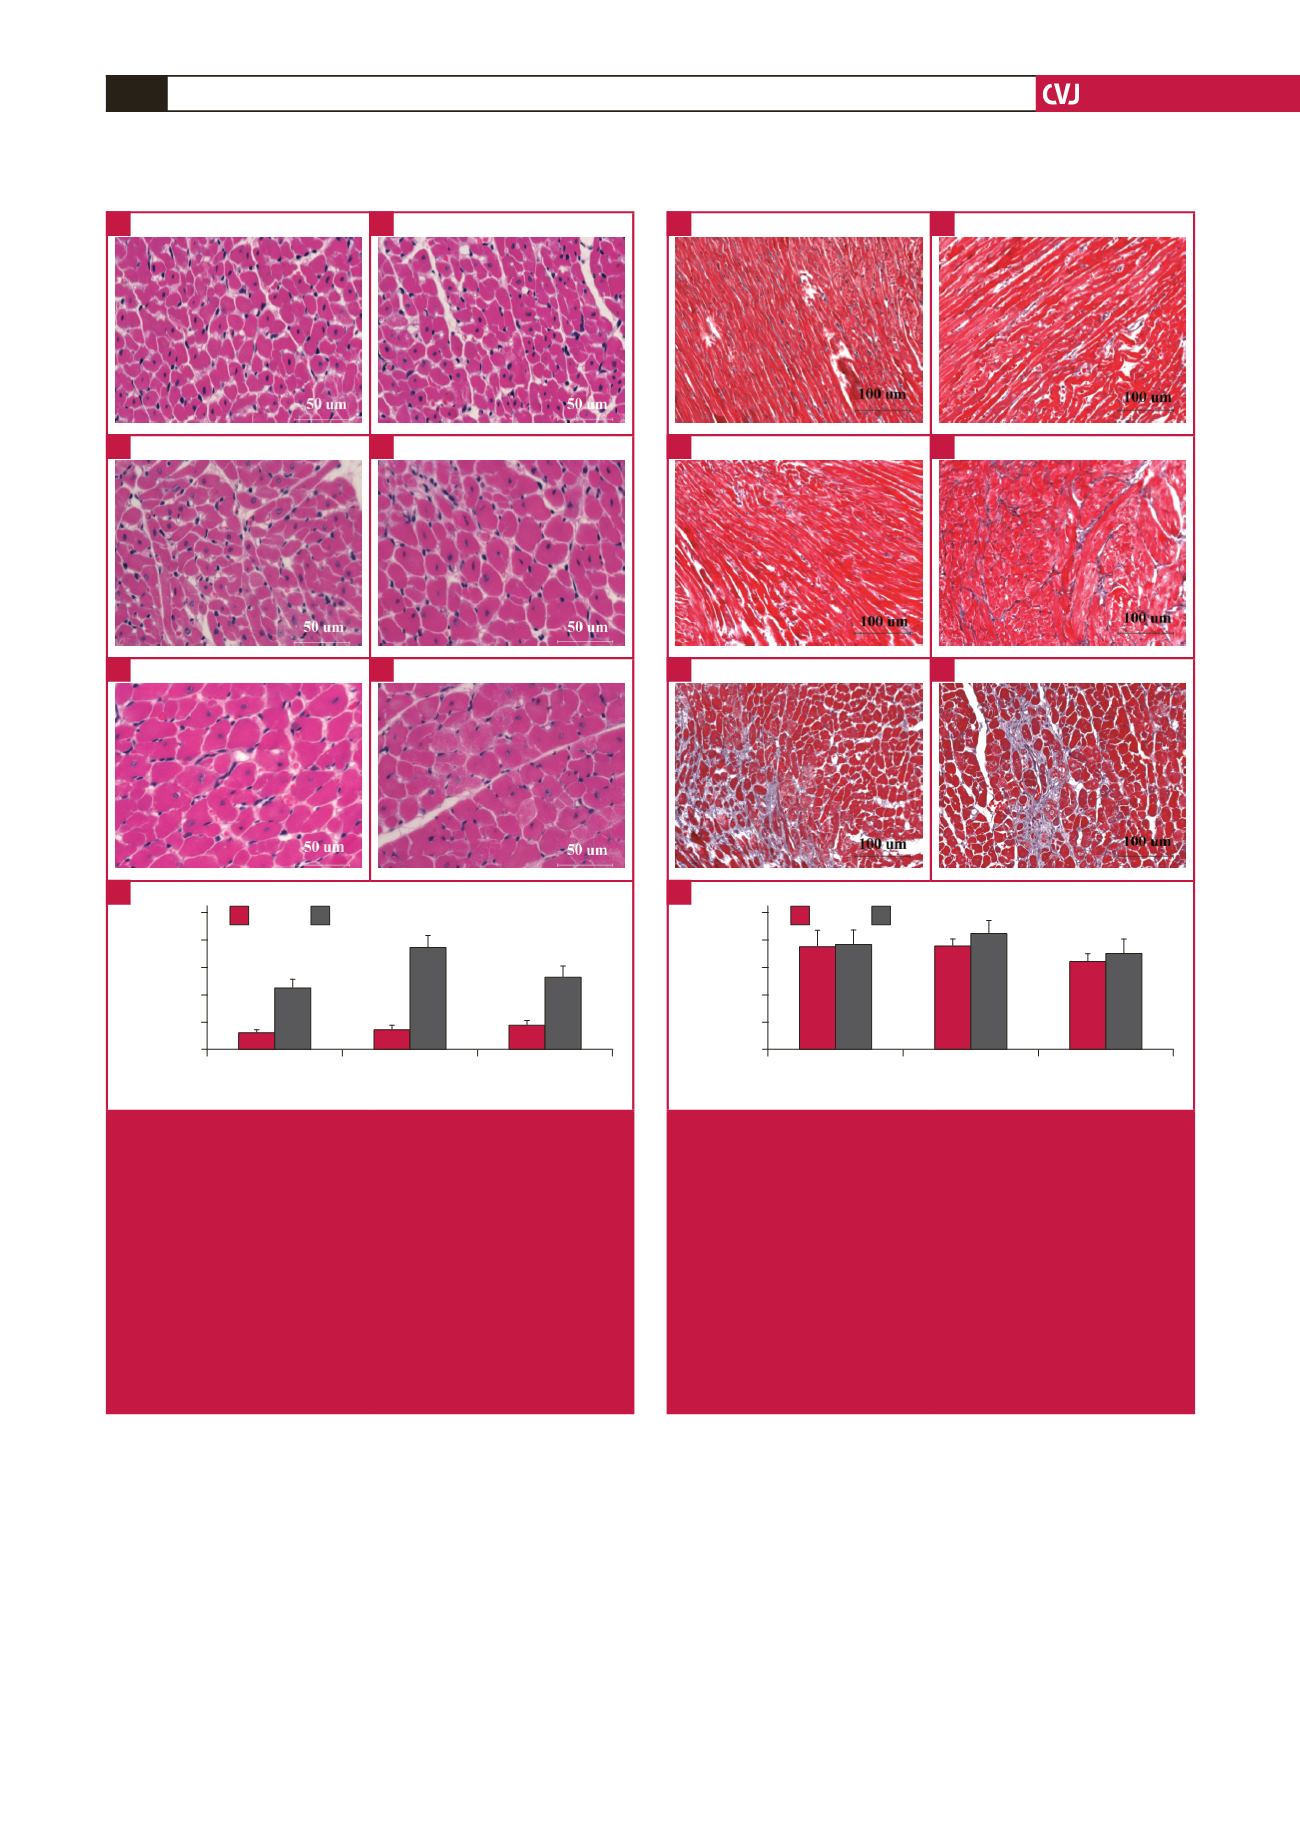
Fig. 7.
Assessment of cardiomyocyte cross-sectional area
(CSA). (A–F) H&E staining (
×
400) and myocyte
cross-sectional area. Data are presented as mean
±
SEM. **
p
<
0.01 vs sham control. A: sham rats at three
weeks, B: sham rats at four weeks, C: sham rats at
six weeks, D: AAC rats at three weeks, E: AAC rats at
four weeks, F: AAC rats at six weeks, G: comparison
of cardiomyocyte CSA between the sham and AAC
groups. ANOVA was performed to compare the AAC
and sham groups when the probability value was
statistically significant. An LSD
t
-test was applied for
multiple comparisons.
A
C
E
G
B
D
F
3
4
6
Weeks
Interstitial fibrosis (%)
10
8
6
4
2
0
Sham AAC
Fig. 8.
Comparison of interstitial fibrosis between sham and
AAC groups using Masson trichrome staining (A–F) (
×
200). Data are presented as mean
±
SEM. All
p
-
values
are
>
0.05 vs sham control. A: sham rats at three
weeks, B: sham rats at four weeks, C: sham rats at
six weeks, D: AAC rats at three weeks, E: AAC rats at
four weeks, F: AAC rats at six weeks, G: quantitative
analysis of interstitial fibrosis between the sham and
AAC groups. ANOVA was performed to compare the
AAC and sham groups when the probability value was
statistically significant. An LSD
t
-test was applied for
multiple comparisons.
A
C
E
G
B
D
F


