


 44 / 68

CARDIOVASCULAR JOURNAL OF AFRICA • Volume 31, No 2, March/April 2020
96
AFRICA
Discussion
The main findings of this study are as follows. In a large urban
community sample with prevalent obesity (41.8% of sample) in
South Africa, independent of confounders, insulin resistance
and resistin concentrations combined produced a greater impact
on creatinine concentrations, eGFR and CKD than modifiable
conventional risk factors, including metabolic syndrome features
or DM
per se
. These effects were noted irrespective of whether
conventional BP or alternative obesity-associated haemodynamic
changes (including 24-hour or aortic BP and aortic PWV) were
considered.
Obesity contributes to the development and progression of
CKD.
9-11
Animal-based studies suggest a distinct action of insulin
resistance in contributing to these effects.
30
While a number of
prior studies have demonstrated independent relationshipships
between indices of insulin resistance and CKD,
12-14,37
these studies
also show relationships that are stronger in the presence of
obesity.
12,13
In addition, several of these prior studies have
demonstrated that relationships between insulin resistance and
glomerular function are strengthened by increasing components
of the metabolic syndrome such as central obesity, hypertension
and the presence of dyslipidaemia.
12,37
Therefore, while a
relationship between insulin resistance and CKD is accepted,
the impact of insulin resistance relative to obesity-associated
conventional risk factors on eGFR is unknown.
30
In contrast to previous findings,
12,13,37
we show that relationships
between HOMA-IR and eGFR are unaffected by the extent of
obesity
per se
or the presence of metabolic features (glucose or
102
100
98
96
94
92
90
0
1 2 3 4 5 6 7 8
* * *
* *
#
(107) (110) (104) (105) (109) (102) (107) (106)
(n =)
Octiles of log resistin
Multivariate adjusted eGFR (ml/min/1.73 m
2
)
102
98
94
90
86
0
1 2 3 4 5 6 7 8
* *
*
#
(105) (104) (109) (102) (105) (109) (107) (109)
(n =)
Octiles of log HOMA–IR
Multivariate adjusted eGFR (ml/min/1.73 m
2
)
# #
*
#
**
#
$
&
||
105
100
95
90
85
0
1 2 3 4 5 6 7 8
** ** ** **
(98) (115) (93) (91) (125) (107) (115) (106)
(n =)
Octiles of SBP
Multivariate adjusted eGFR (ml/min/1.73 m
2
)
**
** *
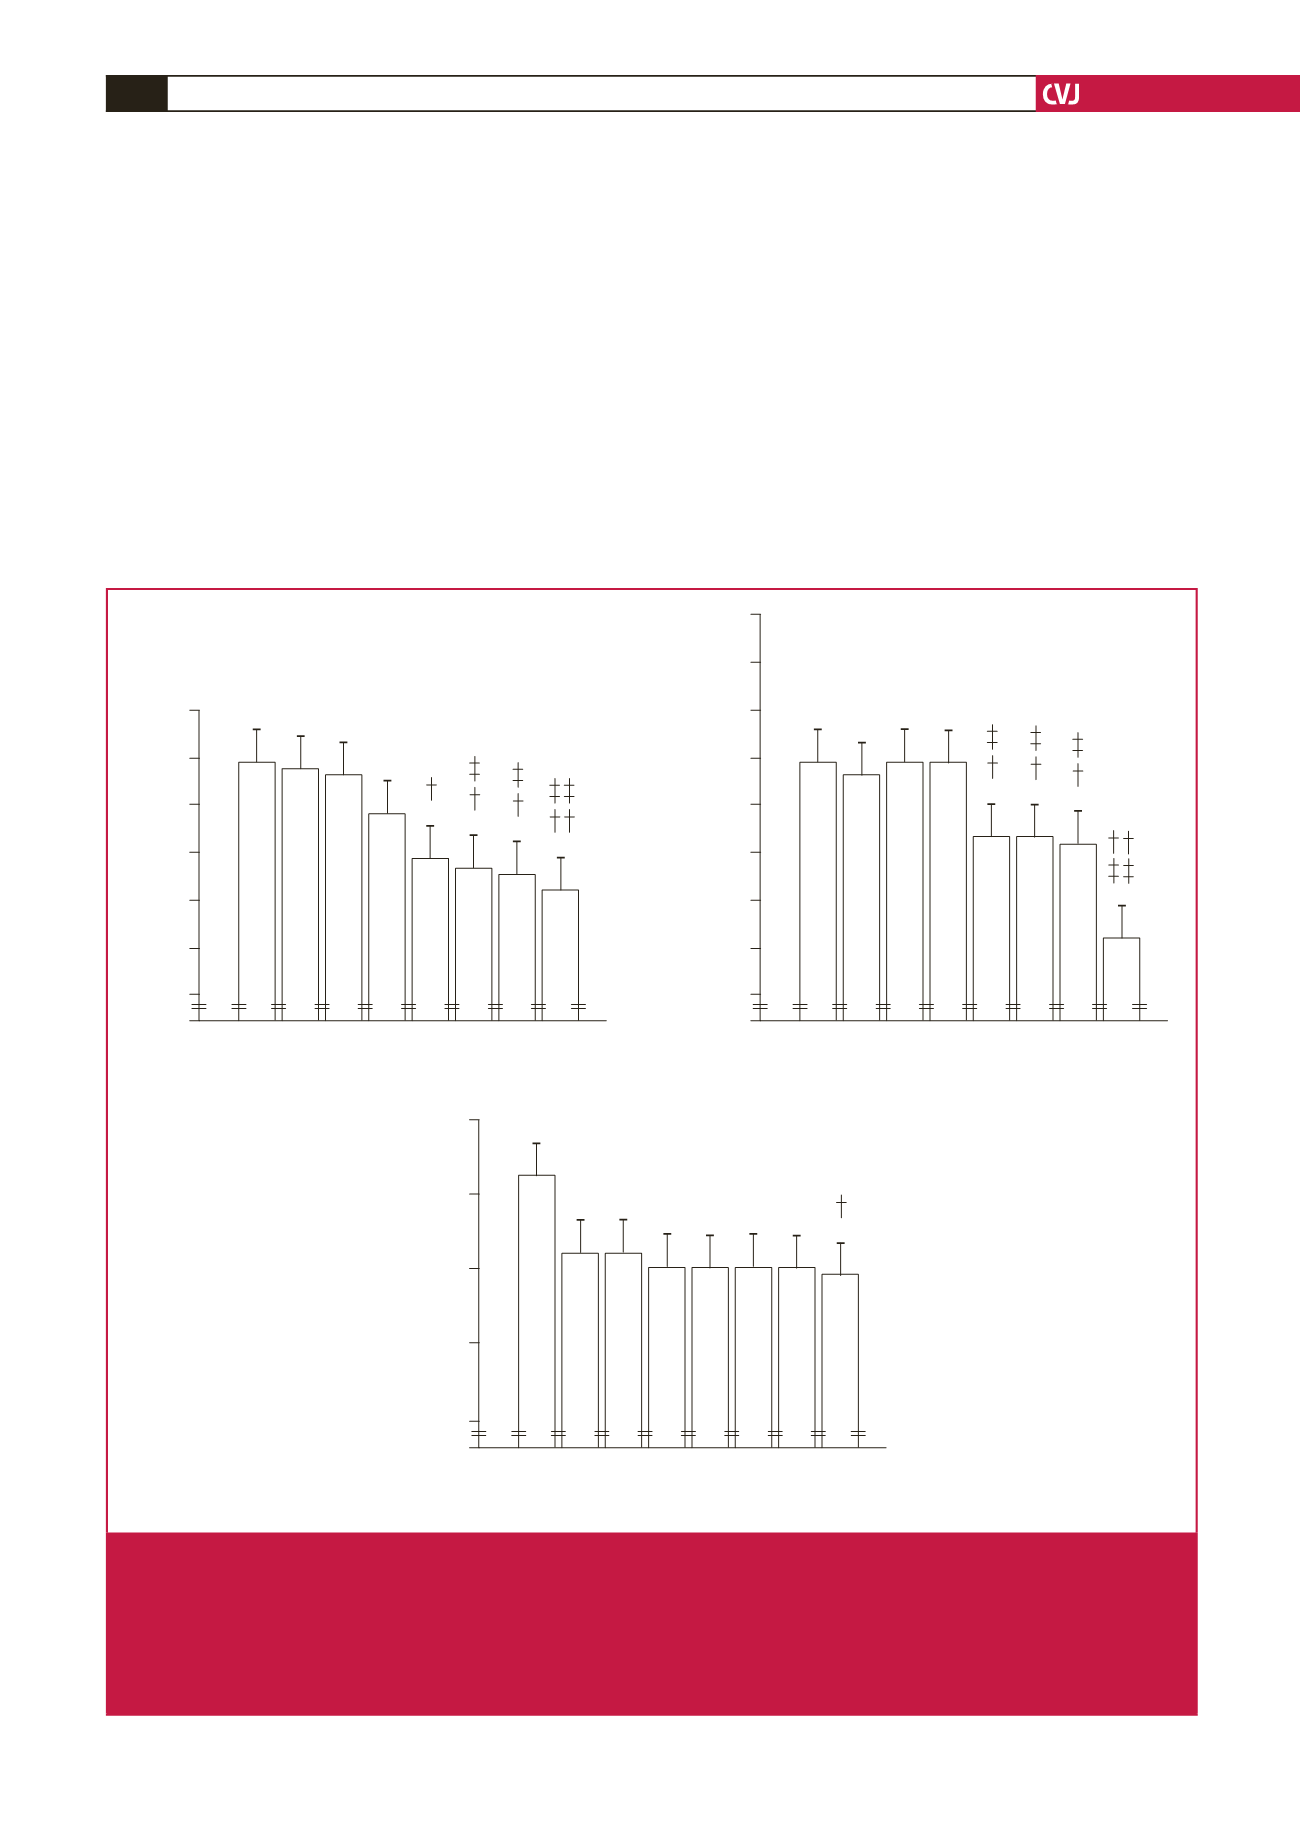
Fig. 3.
Multivariate adjusted estimated glomerular filtration rates (eGFR) across octiles of the homeostasis model of insulin resist-
ance (HOMA-IR) or plasma resistin concentrations compared to systolic blood pressure in non-diabetic participants of a
community sample (
n
=
850). Adjustments are for age, gender, waist circumference, conventional systolic blood pressure (for
HOMA-IR and resistin), regular tobacco use, regular alcohol consumption and metabolic syndrome features. SBP, systolic
blood pressure. *
p
<
0.05, **
p
<
0.005, ***
p
<
0.0001 vs octile 1,
†
p
<
0.05,
††
p
<
0.0001 versus octile 2,
‡
p
<
0.05,
‡‡
p
<
0.0001
versus octile 3,
#
p
<
0.05,
##
p
<
0.0001 versus octile 4,
$
p
<
0.05 versus octile 5,
&
p
<
0.05 versus octile 6,
║
p
<
0.05 versus
octile 7.