


 45 / 68

CARDIOVASCULAR JOURNAL OF AFRICA • Volume 31, No 2, March/April 2020
AFRICA
97
lipid abnormalities or the metabolic syndrome
per se
), neither
of which showed strong independent correlations with eGFR.
In addition, these effects were independent of BP. These data
therefore support a view that the adverse renal effects of insulin
resistance are distinct from that of obesity, associated metabolic
features or the metabolic syndrome
per se
, and that the impact is
at least as strong as that of modifiable conventional risk factors
(BP).
Importantly, in combination with circulating resistin
concentrations, the impact of insulin resistance is markedly
stronger than the combined impact of modifiable conventional
risk factors. Consequently, targeting conventional risk factors
alone, including obesity and associated metabolic abnormalities,
may result in a marked residual impact on the development of
CKD in communities with a high prevalence of obesity. As the
relationships between insulin resistance and eGFR in the present
study cannot be accounted for by obesity or associated metabolic
features, further studies are urgently required to identify the
origins of the insulin resistance beyond obesity in the South
African context.
There is also evidence to support a role for adipocytokines
(obesity-associated inflammatory changes) in the development
and progression of CKD.
18,21,25,26,28,29
Animal-based studies
similarly suggest a distinct action of inflammatory substances in
contributing to these effects.
31,32
However, clinical data are again
unclear as to the relative impact of adipocytokines compared
to that of conventional risk factors on renal function. While
a number of prior studies have demonstrated relationships
between circulating concentrations of adipocytokines and
CKD,
18,21,25,26,28,29
whether these relationships are stronger in the
100
95
90
85
0
1 2 3 4 5 6 7 8
* **
(126) (124) (119) (126) (125) (120) (120) (124)
(n =)
Octiles of log resistin
Multivariate adjusted eGFR (ml/min/1.73 m
2
)
**
***
##
$
100
95
90
85
0
1 2 3 4 5 6 7 8
* *
(123) (121) (123) (120) (121) (125) (125) (126)
(n =)
Octiles of log HOMA–IR
Multivariate adjusted eGFR (ml/min/1.73 m
2
)
*
***
###
$
#
&
||
105
100
95
90
85
0
1 2 3 4 5 6 7 8
* ** **
(106) (122) (138) (106) (101) (159) (120) (132)
(n =)
Octiles of SBP
Multivariate adjusted eGFR (ml/min/1.73 m
2
)
*
*
**
***
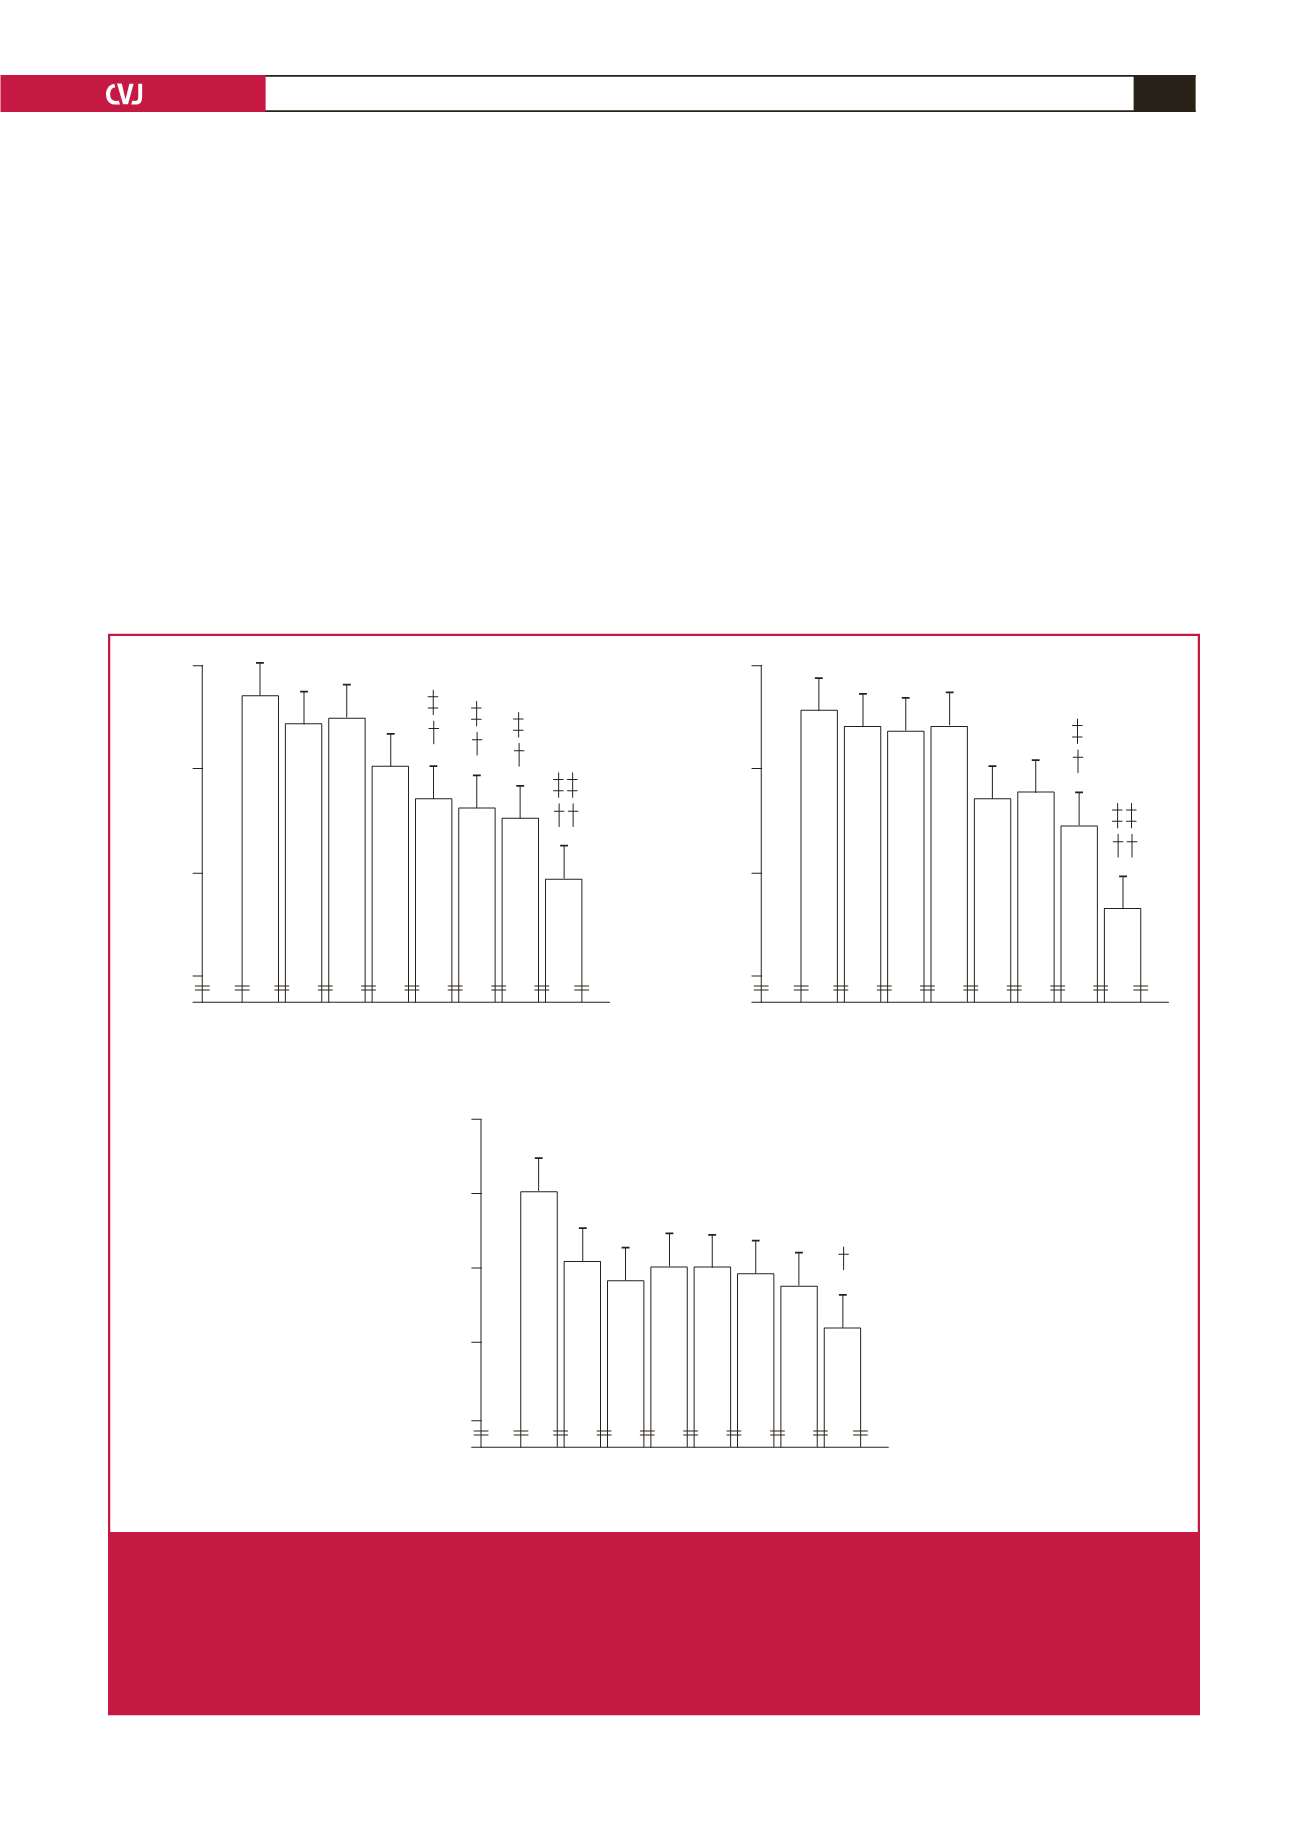
Fig. 4.
Multivariate adjusted estimated glomerular filtration rates (eGFR) across octiles of the homeostasis model of insulin resist-
ance (HOMA-IR) or plasma resistin concentrations compared to systolic blood pressure in a community sample (
n
=
984).
Adjustments are for age, gender, waist circumference, conventional systolic blood pressure (for HOMA-IR and resistin),
regular tobacco use, regular alcohol consumption, diabetes mellitus, HbA
1c
and the metabolic syndrome. SBP, systolic blood
pressure. *
p
<
0.05, **
p
<
0.005, ***
p
<
0.0001 vs octile 1,
†
p
<
0.05,
††
p
<
0.0001 versus octile 2,
‡
p
<
0.05,
‡‡
p
<
0.0001 versus
octile 3,
#
p
<
0.05,
##
p
<
0.005,
###
p
<
0.0001 versus octile 4,
$
p
<
0.05 versus octile 5,
&
p
<
0.05 versus octile 6,
║
p
<
0.05
versus octile 7.