


 43 / 68

CARDIOVASCULAR JOURNAL OF AFRICA • Volume 31, No 2, March/April 2020
AFRICA
95
The independent relationships between HOMA-IR and
eGFR (partial
r
, obese
=
–0.181,
p
<
0.005, non-obese
=
–0.162,
p
<
0.0005) or creatinine concentrations (data not shown) were
similar in obese versus non-obese participents. Furthermore, the
independent relationships between resistin concentrations and
eGFR (partial
r,
obese
=
–0.128,
p
<
0.02, non-obese
=
–0.149,
p
<
0.001) or creatinine concentrations (data not shown) were
similar in obese versus non-obese participents. Importantly,
the relationships between resistin and eGFR were as robust
in unrelated participants (parents alone, partial
r
=
–0.214,
p
<
0.005) as in related participants (parents and their children
and siblings, partial
r
=
–0.139,
p
<
0.0001). Moreover, the
independent relationships between resistin concentrations and
eGFR were independent of CRP concentrations (Table 7).
In stepwise regression models, HOMA-IR and resistin
concentrations were second and third only to age and at least as
strong as BP or PWV in the impact (standardised
β
-coefficient)
on eGFR and CKD in both the non-diabetic participants (Tables
8, 9) as well as in all participants (Tables 10, 11). The impact of
HOMA-IR and resistin concentrations together on eGFR or
CKD was markedly greater than the impact of conventional
risk factors, including metabolic syndrome features, combined.
The relative impact of HOMA-IR or resistin concentrations on
eGFR or CKD were similar irrespective of whether conventional
brachial BP, 24-hour BP, aortic BP or aortic PWV were included
in the regression models in both the non-diabetic participants
(Tables 8, 9) as well as in all participants (Tables 10, 11).
The independent relationships between insulin resistance
or resistin concentrations and eGFR were independent of
each other (Tables 8, 9, non-diabetic participants; Tables 10,
11, all participants) and of CRP concentrations (Table 7).
Independent relationships between insulin resistance or resistin
concentrations and creatinine concentrations or eGFR translated
into comparable stepwise decreases in eGFR across octiles of
HOMA-IR or resistin concentrations, as did changes in eGFR
across octiles of systolic BP (Figs 3, 4).
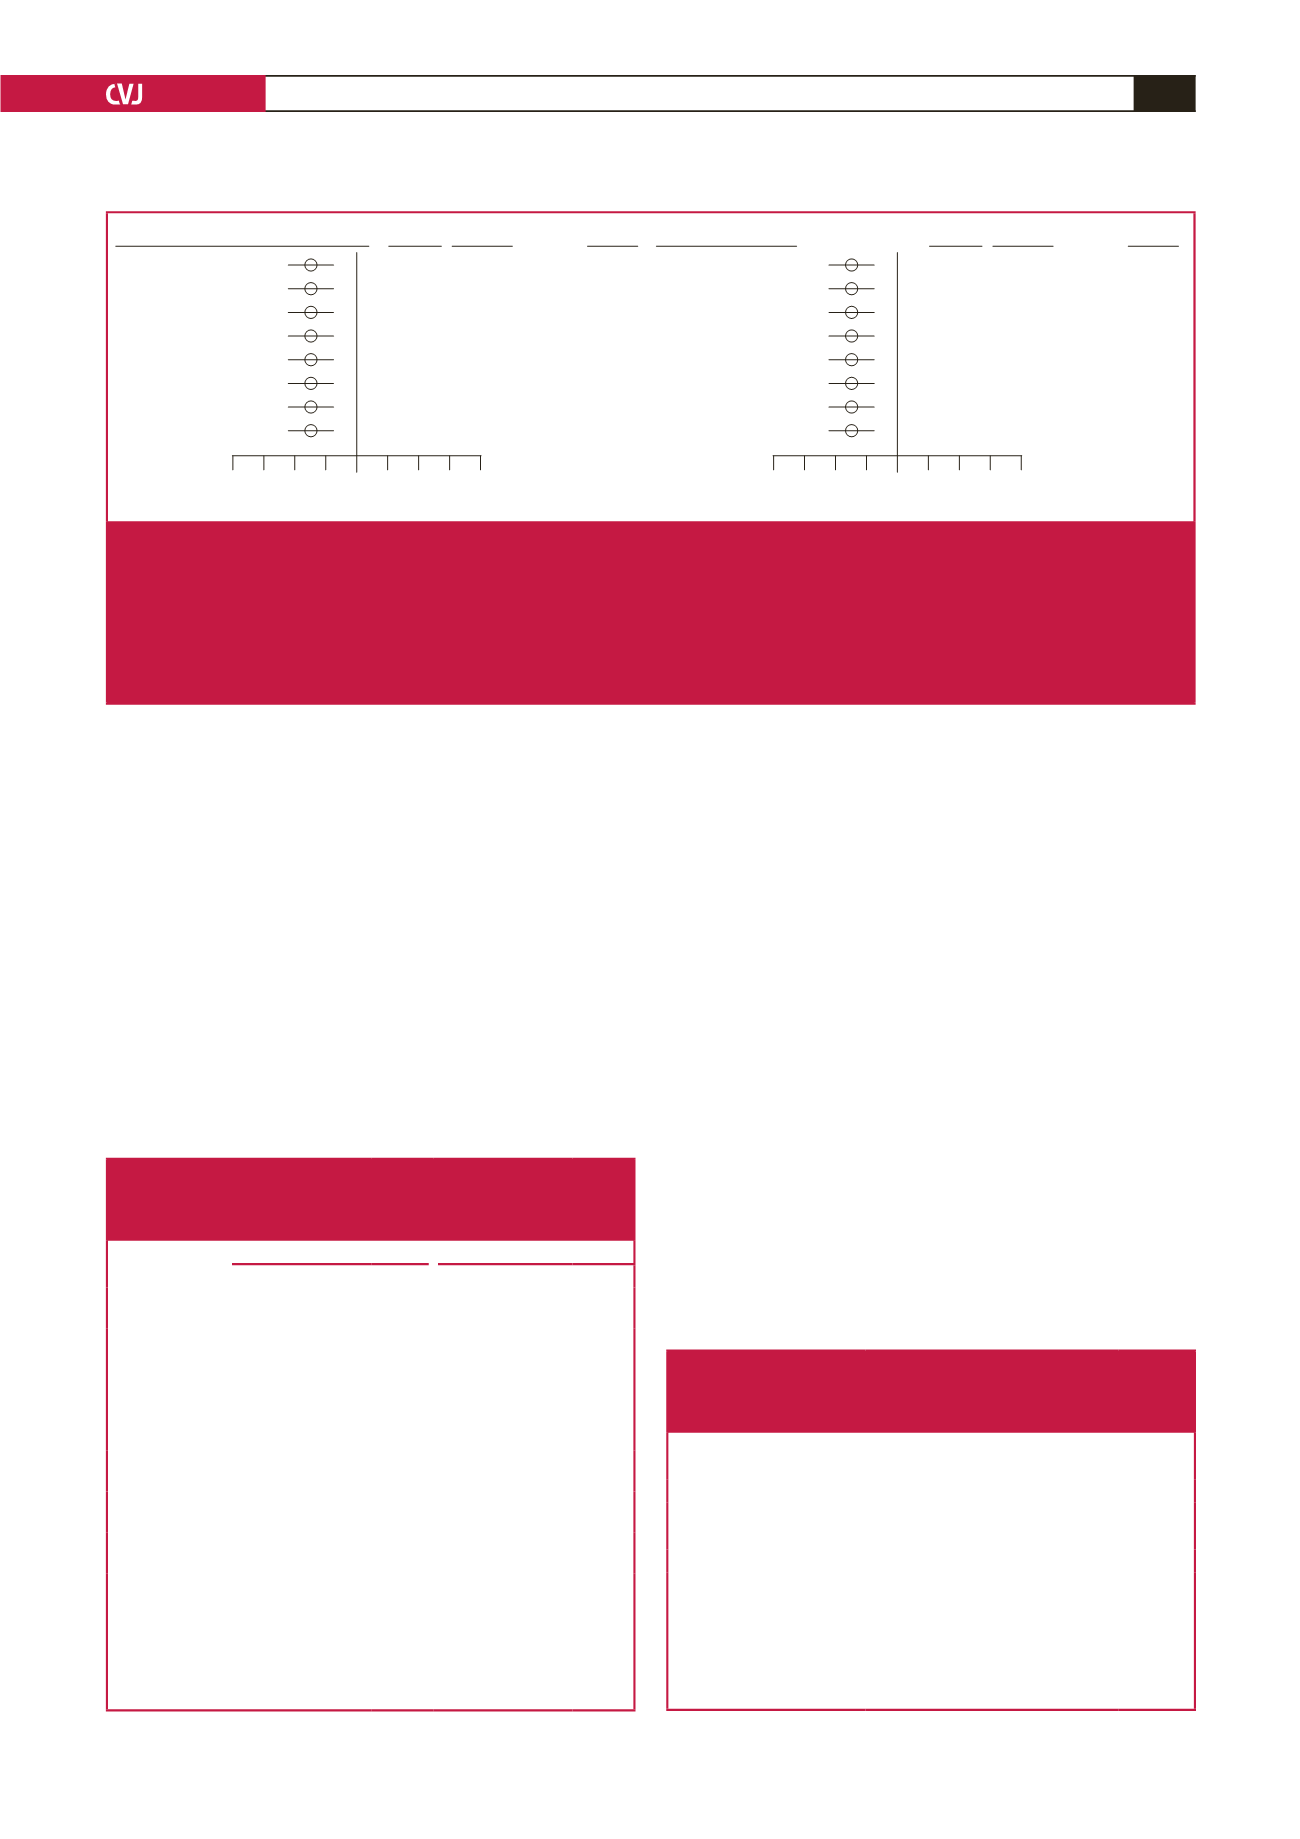
GFR–CKD–EPI versus log HOMA–IR
adj. + MetS
adj. + BMI
adj. + Waist circ.
adj. + WHR
adj. + Blood glucose
adj. + Triglycerides
adj. + HDL
adj. + LDL
Partial
r
(95% CI)
p
-value
–0.157 (–0.217 to –0.095)
<
0.0001
–0.162 (–0.222 to –0.101)
<
0.0001
–0.178 (–0.238 to –0.116)
<
0.0001
–0.166 (–0.227 to –0.104)
<
0.0001
–0.152 (–0.212 to –0.090)
<
0.0001
–0.160 (–0.220 to –0.098)
<
0.0001
–0.154 (–0.214 to –0.092)
<
0.0001
–0.155 (–0.215 to –0.093)
<
0.0001
–0.4 –0.3 –0.2 –0.1 0 0.1 0.2 0.3 0.4
Partial correlation coefficient
PI versus log resistin
adj. + MetS
adj. + BMI
adj. + Waist circ.
adj. + WHR
adj. + Blood glucose
adj. + Triglycerides
adj. + HDL
adj. + LDL
Partial
r
(95% CI)
p
-value
–0.169 (–0.229 to –0.108)
<
0.0001
–0.170 (–0.230 to –0.109)
<
0.0001
–0.171 (–0.232 to –0.109)
<
0.0001
–0.174 (–0.235 to –0.111)
<
0.0001
–0.171 (–0.231 to –0.109)
<
0.0001
–0.169 (–0.229 to –0.107)
<
0.0001
–0.168 (–0.228 to –0.106)
<
0.0001
–0.171 (–0.231 to –0.109)
<
0.0001
–0.4 –0.3 –0.2 –0.1 0 0.1 0.2 0.3 0.4
Partial correlation coefficient
Fig. 2.
Independent relationships between the homeostasis model of insulin resistance (HOMA-IR), or plasma resistin concentra-
tions and estimated glomerular filtration rate (eGFR) beyond indices of adiposity or obesity-associated metabolic features
in a community sample (
n
=
984). Adjustments are for age, gender, conventional systolic blood pressure, regular tobacco
use, regular alcohol consumption, diabetes mellitus, HbA
1c
and the adiposity index or metabolic syndrome features indi-
cated. CKD-EPI, Chronic Kidney Disease Epidemiology equation; CI, confidence interval; MetS, the metabolic syndrome;
BMI, body mass index; WC, waist circumference; WHR, waist-to-hip ratio; LDL, low-density lipoprotein; HDL, high-density
lipoprotein.
Table 4. Multivariate adjusted relationships between adiposity indices
or obesity-related metabolic changes and estimated glomerular
filtration rate in non-diabetic participants of a community sample
(
n
=
850)
MDRD eGFR
CKD-EPI eGFR
eGFR versus
Partial
r
(95% CI)
p
-value Partial
r
(95% CI)
p
-value
Body mass index
–0.035
(–0.10 to 0.03)
0.31
0.018
(–0.08 to 0.05)
0.60
Waist
circumference
–0.027
(–0.09 to 0.04)
0.44
–0.009
(–0.08 to 0.06)
0.78
Waist:hip ratio
–0.019
(–0.09 to 0.05)
0.59
–0.010
(–0.08 to 0.06)
0.78
Glucose
–0.103
(–0.17 to –0.04)
<
0.01
–0.097
(–0.16 to –0.03)
<
0.01
Triglycerides
–0.004
(–0.07 to 0.06)
0.91
0.002
(–0.06 to 0.07)
0.95
HDL-C
0.045
(–0.02 to 0.11)
0.19
0.044
(–0.02 to 0.11)
0.20
LDL-C
–0.094
(–0.16 to –0.03)
<
0.01
–0.083
(–0.15 to –0.02)
<
0.05
Metabolic
syndrome
–0.088
(–0.15 to –0.02)
<
0.01
–0.062
(–0.13 to 0.01)
0.07
LDL-C, low-density lipoprotein cholesterol; HDL-C, high-density lipoprotein
cholesterol; eGFR, estimated glomerular filtration rate; MDRD, Modification
of Diet in Renal Disease equation; CKD-EPI, Chronic Kidney Disease
Epidemiology equation. Adjustments are for age, gender, conventional systolic
blood pressure, regular tobacco use and regular alcohol consumption.
Table 5. Multivariate-adjusted (partial
r
) relationships between
C-reactive protein concentrations and estimated glomerular
filtration rate in non-diabetic participants of a community
sample and the full community sample
CRP versus
Partial
r
(95% CI)
p
-value
Non-diabetic participants
MDRD eGFR
–0.05 (–0.11–0.02)
0.17
CKD-EPI eGFR
–0.05 (–0.12–0.02)
0.16
All participants
MDRD eGFR
–0.05 (–0.11–0.01)
0.13
CKD-EPI eGFR
–0.04 (–0.10–0.02)
0.19
CRP, C-reactive protein; eGFR, estimated glomerular filtration rate; MDRD,
Modification of Diet in Renal Disease equation; CKD-EPI, Chronic Kidney
Disease Epidemiology equation.
Adjustments are for age, gender, conventional systolic blood pressure, waist
circumference, regular tobacco use, regular alcohol consumption, diabetes melli-
tus (in all participants), HbA
1c
(in all participants) and the metabolic syndrome.