


 42 / 68

CARDIOVASCULAR JOURNAL OF AFRICA • Volume 31, No 2, March/April 2020
94
AFRICA
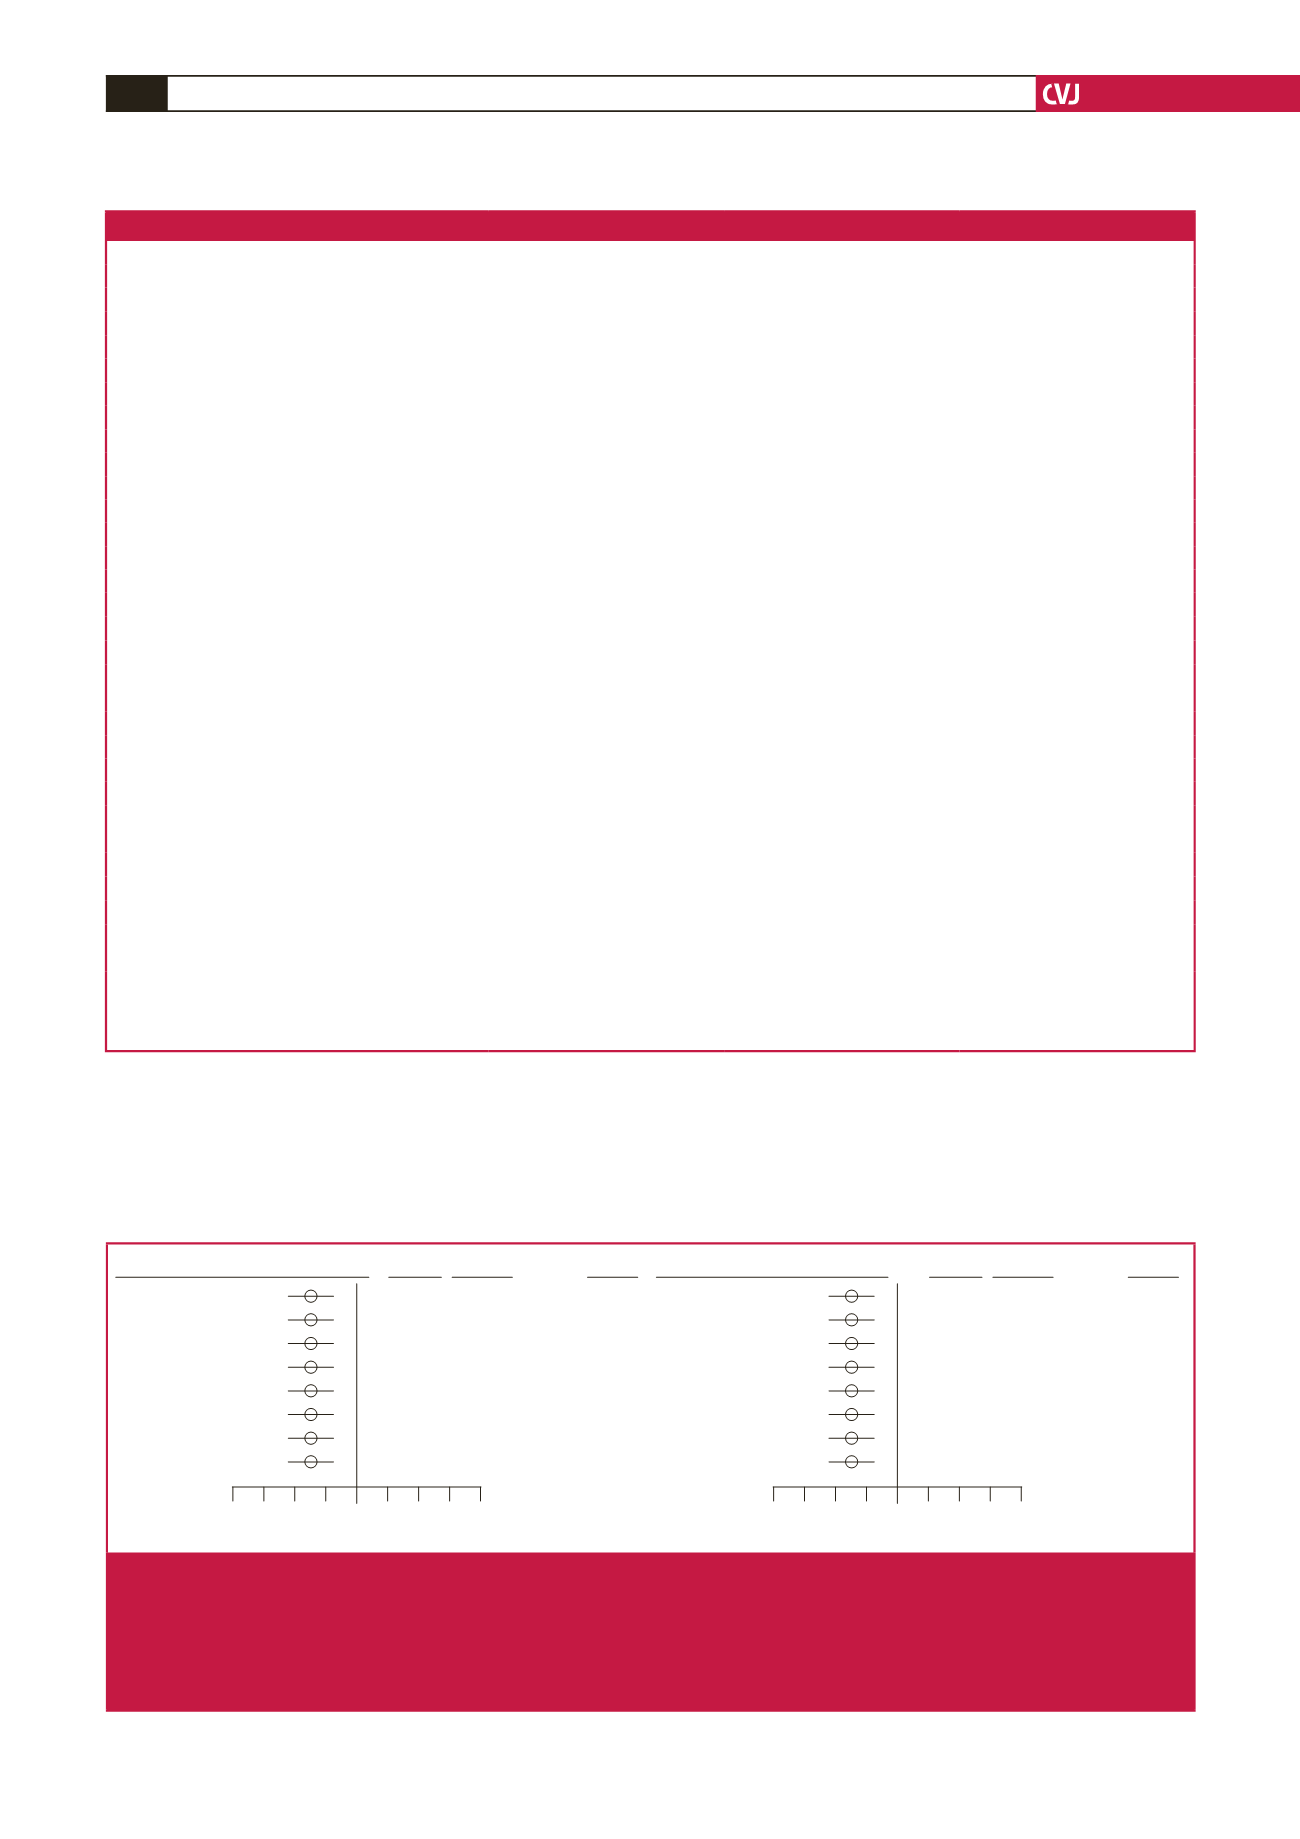
features, HOMA-IR and plasma resistin concentrations (Figs
1, 2), but not CRP concentrations (Table 5) were independently
associated with creatinine concentrations or eGFR and these
effects were unaffected by adjustments for adiposity indices or
obesity-associated metabolic abnormalities, including metabolic
syndrome features (Figs 1, 2). The independent relationships
between HOMA-IR or resistin concentrations and eGFR or
creatinine concentrations were noted in several subgroups of
the sample, including men and women separately (Table 6), and
across tertiles of adiposity indices (data not shown).
Table 3. Participant characteristics
Characteristics
All
With 24-hour BP
With PWV
Number (% female)
1010 (63.6)
688 (62.9)
896 (62.2)
Age (years)
44.0
±
18.2
43.9
±
18.1
43.5
±
18.4
Body mass index (kg/m
2
)
29.3
±
7.9
28.7
±
7.6
28.6
±
7.4
% overweight/obese
23.5/41.8
25.4/38.2
24.3/38.8
Waist circumference (cm)
90.6
±
16.8 (
n
=
984)
89.7
±
16.4 (
n
=
669)
89.5
±
16.1 (
n
=
876)
% abdominal obesity
44.9
41.9
41.8
Waist:hip ratio
0.84
±
0.10 (
n
=
984)
0.84
±
0.10 (
n
=
669)
0.83
±
0.10 (
n
=
876)
Regular tobacco (% subjects)
14.7
14.8
16.1
Regular alcohol (% subjects)
19.9
20.3
20.5
% females postmenopausal
43.8
41.8
42.9
% diabetes mellitus
13.7
12.8
13.1
% glucose-lowering agents
7.5
7.0
7.3
% hypertension
44.7
43.3
43.8
Current antihypertensive meds (%)
22.9
21.1
22.1
Glucose (mmol/l)
5.26
±
2.46
5.30
±
2.60
5.26
±
2.54
LDL-C (mmol/l)
2.63
±
0.94
2.62
±
0.97
2.63
±
0.95
HDL-C (mmol/l)
1.40
±
0.41
1.41
±
0.41
1.41
±
0.42
Triglycerides (mmol/l)
1.24
±
1.12
1.25
±
1.28
1.23
±
1.15
Metabolic syndrome (%)*
28.5/25.1/13.7/11.8
29.1/24.1/14.1/11.1
29.2/24.8/13.2/10.2
Insulin (
µ
U/ml)
8.45 (4.15–15.32)
8.92 (4.32–17.2)
8.32 (4.02–15.00)
HOMA-IR
1.80 (0.84–3.74)
1.86 (0.88–4.19)
1.74 (0.82–3.65)
Resistin (ng/ml)
10.8 (7.7–15.7)
10.5 (7.5–15.2)
10.7 (7.7–15.5)
C-reactive protein (ng/ml)
3.80 (1.42–8.44)
3.45 (1.24–8.37)
3.65 (1.31–8.06)
Office SBP/DBP (mm Hg)
128
±
22/84
±
13
128
±
22/83
±
12
128
±
22/83
±
12
24-hour SBP/DBP (mm Hg)
118
±
15/72
±
10 (
n
=
688)
118
±
15/72
±
10
118
±
15/72
±
10
Aortic PWV (m/s)
6.26
±
2.67 (
n
=
896)
6.39
±
2.78 (
n
= 608)
6.26
±
2.67
Aortic SBP (mm Hg)
120
±
22
119
±
22
119
±
22
Creatinine (
µ
mol/l)
75.1
±
22.0
75.6
±
19.9
75.0
±
22.3
eGFR (MDRD) (ml/min/1.73 m
2
)
94.3
±
26.1
93.8
±
25.9
95.0
±
25.8
eGFR (CKD-EPI) (ml/min/1.73 m
2
)
95.0 ± 22.2
94.5
±
22.3
95.7
±
22.1
Data shown are mean
±
SD, median and interquartile range and proportions. PWV, pulse-wave velocity; LDL-C, low-density lipoprotein cholesterol; HDL-C, high-
density lipoprotein cholesterol; HOMA-IR, homeostasis model of insulin resistance; SBP, systolic blood pressure; DBP, diastolic BP; eGFR, estimated glomerular
filtration rate; MDRD, Modification of Diet in Renal Disease equation; CKD-EPI, Chronic Kidney Disease Epidemiology equation. *Metabolic syndrome (%) is
percentage of individuals with one/two/three/four components of the metabolic syndrome.
GFR–CKD–EPI versus log HOMA–IR
adj. + MetS
adj. + BMI
adj. + Waist circ.
adj. + WHR
adj. + Blood glucose
adj. + Triglycerides
adj. + HDL
adj. + LDL
Partial
r
(95% CI)
p
-value
–0.162 (–0.226 to –0.097)
<
0.0001
–0.176 (–0.240 to –0.111)
<
0.0001
–0.192 (–0.256 to –0.126)
<
0.0001
–0.181 (–0.246 to –0.114)
<
0.0001
–0.141 (–0.206 to –0.075)
<
0.0001
–0.178 (–0.242 to –0.112)
<
0.0001
–0.170 (–0.234 to –0.104)
<
0.0001
–0.170 (–0.234 to –0.104)
<
0.0001
–0.4 –0.3 –0.2 –0.1 0 0.1 0.2 0.3 0.4
Partial correlation coefficient
GFR–CKD–EPI versus log resistin
adj. + MetS
adj. + BMI
adj. + Waist circ.
adj. + WHR
adj. + Blood glucose
adj. + Triglycerides
adj. + HDL
adj. + LDL
Partial
r
(95% CI)
p
-value
–0.127 (–0.192 to –0.061)
=
0.0002
–0.131 (–0.195 to –0.064)
=
0.0001
–0.133 (–0.199 to –0.066)
=
0.0001
–0.135 (–0.201 to –0.067)
=
0.0001
–0.130 (–0.195 to –0.063)
=
0.0001
–0.130 (–0.195 to –0.064)
=
0.0001
–0.128 (–0.193 to –0.062)
=
0.0002
–0.131 (–0.196 to –0.065)
=
0.0001
–0.4 –0.3 –0.2 –0.1 0 0.1 0.2 0.3 0.4
Partial correlation coefficient
Fig. 1.
Independent relationships between the homeostasis model of insulin resistance (HOMA-IR), or plasma resistin concentra-
tions and estimated glomerular filtration rate (eGFR) beyond indices of adiposity or obesity-associated metabolic features
in non-diabetic participants of a community sample (
n
=
850). Adjustments are for age, gender, conventional systolic blood
pressure, regular tobacco use, regular alcohol consumption and the adiposity index or metabolic syndrome features indicated.
CKD-EPI, Chronic Kidney Disease Epidemiology equation; CI, confidence interval; MetS, the metabolic syndrome; BMI, body
mass index; WC, waist circumference; WHR, waist-to-hip ratio; LDL, low-density lipoprotein; HDL, high-density lipoprotein.