


 63 / 92

CARDIOVASCULAR JOURNAL OF AFRICA • Volume 27, No 4, July/August 2016
AFRICA
265
We finally adjusted for cSBP when comparing the
normotensive and hypertensive groups (Table 3), resulting in
no significant differences in the carotid characteristics between
the groups. When cSBP was substituted with either brachial
SBP (
p
=
0.029) or mean arterial pressure (MAP) (
p
=
0.0012),
the difference in distensibility remained, but the more physical
measures such as IMT, CSWA and LD did not differ.
In sensitivity analysis, we further compared hypertensives who
were not using anti-hypertensive therapy (
n
=
227) with treated
hypertensives (
n
=
124) and normotensives, applying similar
adjustments, including cSBP. We found results similar to those in
Table 3 (Table 4). Furthermore, excluding participants on anti-
hypertensive medication and comparing the normotensive group
to the treated hypertensive group did not change the results. The
types of medication used by the hypertensive participants are
shown in Table 5.
Table 6 reports the forward stepwise multiple regression analyses
performed in the normotensive and hypertensive groups with either
CD or IMT as dependent variables. As expected, CD associated
with cSBP in both groups (
p
<
0.001), however, IMT associated
independently with cSBP in the hypertensive group only (
p
=
0.016).
Table 7 reports the forward stepwise regression analyses
performed in the normotensive and hypertensive groups with
either CSWA or maximum LD as the dependent variables.
CSWA associated with cSBP (
p
<
0.001) in the hypertensive
group only, whereas maximum LD associated with cSBP in both
the normotensive and hypertensive groups.
<
119
119–133
133–151
>
151
Central systolic blood pressure (mmHg)
Distensibility (1/kPa
×
10
–3
)
6.0
4.0
2.0
0.0
Unadjusted
Adjusted
p
-trend
<
0.001
<
119
119–133
133–151
>
151
Central systolic blood pressure (mmHg)
cIMT (mm)
0.9
0.8
0.7
0.6
0.5
0.4
Unadjusted
Adjusted
p
-trend
<
0.001
<
119
119–133
133–151
>
151
Central systolic blood pressure (mmHg)
CSWA (mm
2
)
20
18
16
14
12
10
Unadjusted
Adjusted
p
-trend
<
0.001
<
119
119–133
133–151
>
151
Central systolic blood pressure (mmHg)
Max LD (mm)
7.0
6.0
5.0
4.0
3.0
Unadjusted
Adjusted
p
-trend
<
0.001
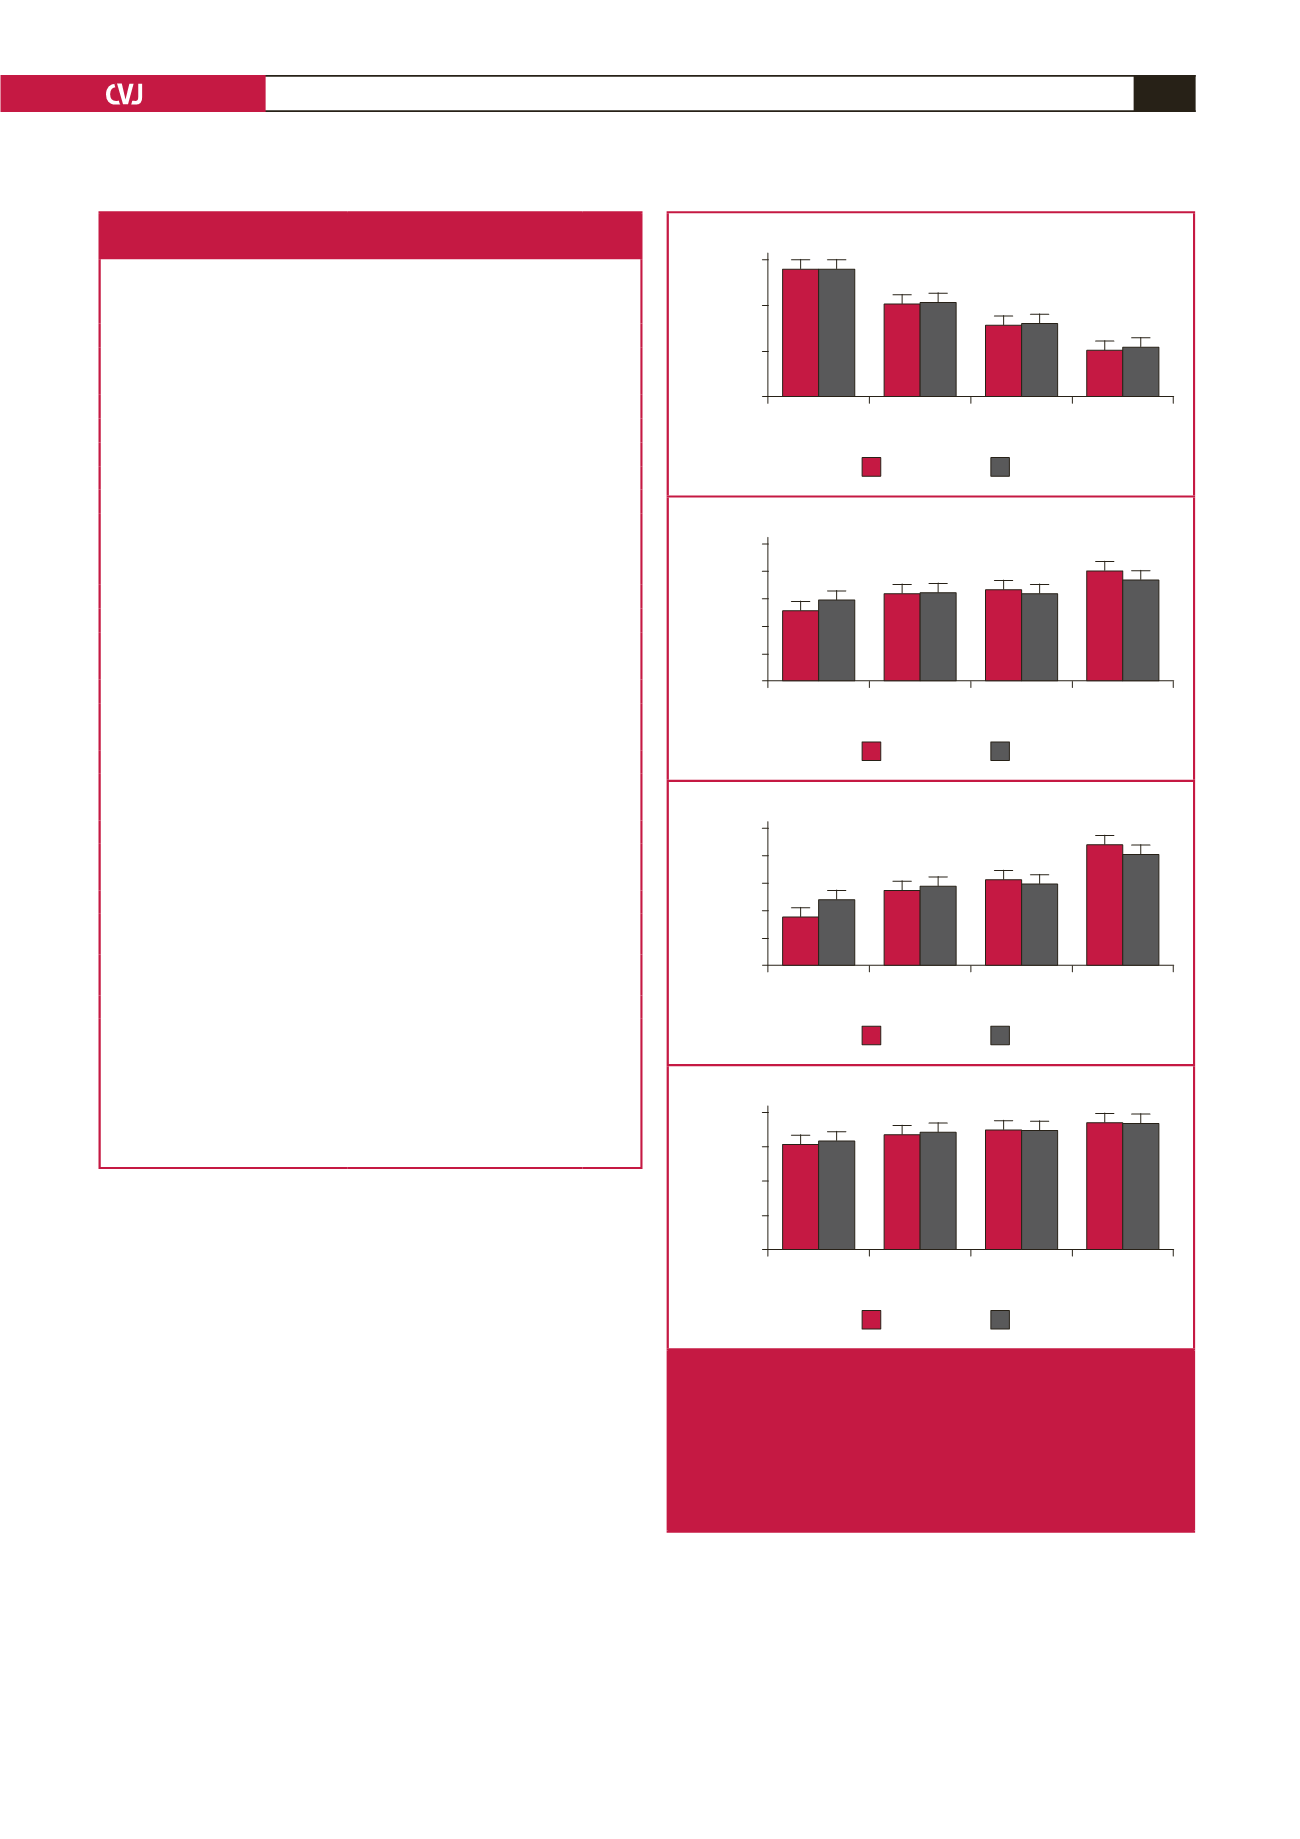
Fig. 2.
Quartiles of central blood pressure plotted against
measures of the carotid artery in the total group (
n
=
592), unadjusted and adjusted for age, gender, waist
circumference, GGT, tobacco and anti-hypertensive
medication use. cIMT, carotid intima–media thickness;
CSWA, cross-sectional wall area; Max LD, maximum
lumen diameter.
Table 2. Adjusted characteristics of normotensive
and hypertensive black Africans
Normotensive
(
n
=
241)
Hypertensive
(
n
=
351)
p
-value
Cardiovascular measures
Brachial SBP, mm Hg
120
±
20.0
155
±
20.7
<
0.001
Brachial DBP, mm Hg
79.2
±
11.1
99.8
±
11.6
<
0.001
Heart rate, bpm
62.7
±
17.5
66.8
±
18.0
0.017
Central SBP, mm Hg
117
±
20.2
148
±
20.9
<
0.001
Central PP, mm Hg
38.4
±
17.9
49.4
±
18.5
<
0.001
Carotid dorsalis pedis PWV, m/s
8.87
±
2.06
9.37
±
2.13
<
0.001
Carotid characteristics
Distensibility
×
10
-3
, 1/kPa
4.58
±
1.98
3.15
±
2.07
<
0.001
Young’s elastic modulus
×
10
3
, kPa 2.26
±
1.98
3.59
±
2.07
<
0.001
Beta-stiffness index
7.48
±
3.98
8.97
±
4.16
0.002
Intima–media thickness
,
mm
0.72
±
0.14
0.73
±
0.18
0.42
Cross-sectional wall area, mm
2
14.8
±
4.71
16.7
±
4.86
<
0.001
Lumen diameter maximum, mm 6.24
±
0.85
6.51
±
0.92
0.005
Lumen diameter minimum, mm 5.80
±
0.85
6.12
±
0.76
<
0.001
Lipids
HDL-C, mmol/l
1.46
±
0.60
1.50
±
0.73
0.47
LDL-C, mmol/l
2.93
±
1.19
2.90
±
1.27
0.81
Triglycerides, mmol/l
1.16 (1.08–1.24) 1.11 (1.05–1.19)
0.50
Glycaemia
Glucose, mmol/l
5.01 (4.86–5.16) 5.10 (4.97–5.23)
0.43
HbA
1c
, %
6.05 (5.93–6.15) 5.99 (5.89–6.08)
0.44
Inflammatory markers
Interleukin-6, pg/ml
3.62 (3.19–4.11) 4.05 (3.64–4.51)
0.22
C-reactive protein, mg/l
3.41 (2.84–4.08) 3.18 (2.72–3.72)
0.62
Adhesion molecules
Intracellular adhesion molecule-1,
pg/ml
293
±
101
308
±
105
0.13
Vascular adhesion molecule-1,
pg/ml
748 (706–792)
747 (711–785)
0.98
Creatinine clearance, ml/min
90.8 (87.8–94.0) 92.3 (89.6–95.0)
0.54
Data are arithmetic means
±
SD or geometric mean (fifth and 95th percentile
intervals) for logarithmically transformed. Data are adjusted for age, gender, waist
circumference,
γ
-glutamyl transferase, tobacco use and anti-hypertensive medica-
tion use. Pulse-wave velocity and carotid intima–media thickness additionally
adjusted for mean arterial pressure.
n
, number of participants; SBP, systolic blood pressure; DBP, diastolic blood
pressure; PP, pulse pressure; HDL-C, high-density lipoprotein cholesterol; LDL-C,
low-density lipoprotein cholesterol; HbA
1c
, glycated haemoglobin.